


Temperature Belt
- The Sun is the major source of atmospheric temperature.
- The atmosphere receives a low amount of heat energy from the Sun.
- Most of the atmosphere’s energy comes from long-wave terrestrial radiation.
- Heating and cooling of the atmosphere occur through direct solar radiation.
- Energy is also transferred from the earth through conduction, convection, and radiation.
Temperature belts of world
- The three major heat zones of the Earth are:
- Temperate Zone
- Torrid Zone
- Frigid Zone
- These are based on the distance they have from the Equator.
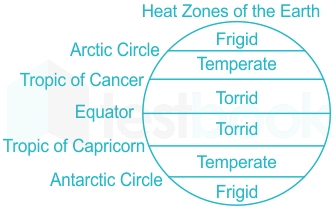
- Torrid Zone (Tropical Zone)
- Hottest zone of the Earth
- Region from Tropic of Cancer (23.5°N) to Tropic of Capricorn (23.5°S)
- Sun’s ray falls directly at least once a year
- Temperate Zone
- Habitable heat zone of the Earth
- Two temperate zones lie in between 23½° to 66½° the hemisphere
- Regions have moderate, tolerable temperatures
- Frigid Zone
- Coldest zone of the Earth
- Area lies to the north of the Arctic circle (66.6°N) and to the south of the Antarctic circle (66.5°S)
- Permanently frozen
- No sunlight for most of the months of the year
- Importance of the Heat Zones:
- Helps in understanding climate changes
- Helps to study weather conditions across the world.
Factors affecting Temperature patterns on the globe
- Latitude:
- Temperature is higher near the equator, and lower away from it (i.e., near the North and South Poles).
- This is because the surface of the earth is curved, so the sun’s rays strike it at different angles in different locations.
- At the equator, the sun’s rays hit the earth’s surface at a 90-degree angle (i.e., vertically), while at the poles, the angle is much smaller.
- Transparency of the atmosphere:
- Aerosols (e.g., smoke, soot), dust, water vapour, clouds, etc. affect transparency.
- The size of the obstructing particle determines whether radiation is scattered or reflected.
- If the wavelength of the radiation is greater than the radius of the obstructing particle (e.g., a gas molecule), scattering occurs.
- If the wavelength is less than the obstructing particle (e.g., a dust particle), reflection occurs.
- Certain particles, such as water vapour, ozone molecules, carbon dioxide molecules, or clouds, absorb solar radiation.
- Most of the light received by the earth is scattered light.
- Land-Sea Differential:
- The albedo of land is greater than that of water, causing land to reflect more solar radiation than water.
- Snow-covered areas reflect up to 70%-90% of insolation.
- Sunlight penetrates deeper into water than into land (up to 20 meters vs. up to 1 meter), causing land to heat up or cool down more rapidly than water.
- Oceans have a continuous convection cycle that helps in heat exchange between layers, keeping temperature ranges low.
- Earth’s Distance from Sun:
- The earth is farthest from the sun on 4th July (152 million km), and nearest on 3rd January (147 million km).
- The annual insolation received on 3rd January is slightly more than that received on 4th July, but this variation is masked by other factors like land-sea distribution and atmospheric circulation.
- This variation in solar output does not have a significant effect on daily weather changes on the earth’s surface.
- Altitude:
- Altitude refers to height above sea level.
- High altitude (e.g., on mountains) is associated with low temperature, while low altitude (e.g., on land surface) is associated with high temperature.
- At higher altitudes, the amount of atmosphere decreases, resulting in less water vapor in the air.
- The atmosphere absorbs less heat at higher altitudes, causing the temperature to drop.
- Distance from the Sea:
- The temperature of places located near the coast is affected differently from those located inland due to the difference in heating of land and water.
- Maritime influence:
- When the sea is cooler than the land in summer, it lowers the temperature of coastal places. During winter, the sea is warmer than the land, moderating winter temperature and keeping coastal places warmer.
- Continental influence:
- Locations in the interior of large continents or land masses are under continental influence and are too far from the sea to be affected by it.
- Inland locations tend to have hotter summers than areas near the coast in similar latitudes due to the land heating up more rapidly.
- Ocean Currents:
- Ocean currents are large streams of water flowing in the oceans.
- They are generated when winds blow over the water surface.
- There are two types of ocean currents: cold currents and warm currents.
- Cold currents bring water from the polar regions.
- Warm currents bring warm water to the polar regions.
- Ocean currents can raise or lower the temperature of nearby coastal areas.
- Warm currents keep coastal areas warm during winter.
- If cold currents move along the coast, they lower the temperatures of the area.
- Types of land surface:
- Dense forest– the vegetation prevents solar radiation from reaching the ground directly. The ground remains cool.
- In the city– the presence of concrete surfaces tends to keep the air temperature high. The concrete surface absorbs heat during the day and retains the heat at night.
- Aspect:
- Aspect refers to the direction in which a slope faces in relation to the sun.
- In tropical areas, aspect is not very important because the sun is high in the sky during mid-day.
- In temperate areas, the sun is at a low angle in winter, and this affects the temperature of slopes that face north to south.
- In the northern hemisphere, south-facing slopes receive a greater concentration of solar radiation than north-facing slopes.
- South-facing slopes are usually warmer than north-facing slopes.
Mean Annual Temperature Distribution
- Isotherm is an imaginary line joining places having equal temperatures.
- A map with isotherms shows the horizontal or latitudinal distribution of temperature.
- Altitude is not considered while drawing an isotherm; all temperatures are reduced to sea levels.
- Isotherms generally follow the parallels, which are the same latitude lines that receive the same amount of insolation.
- There are sudden bends at ocean-continent boundaries due to differential heating of land and water.
- Narrow spacing between isotherms indicates a rapid change in temperature, which means high thermal gradient.
- Wide spacing between isotherms indicates a small or slow change in temperatures, which means low thermal gradient.
General Temperature Distribution
- Highest temperatures occur over tropics and sub-tropics due to high insolation.
- Lowest temperatures occur in polar and subpolar regions and in continental interiors due to the effect of continentality.
- Diurnal and annual range of temperatures are highest in continental interiors and least in oceans due to the effect of continentality and high specific heat of water and mixing of water.
- Low-temperature gradients are observed over tropics and high-temperature gradients over middle and higher latitudes.
- Temperature gradients are usually low over the eastern margins of continents and high over the western margins of continents due to warm and cold ocean currents, respectively.
- Isotherms are irregular over the northern hemisphere due to the predominance of land over water, making the northern hemisphere warmer.
- The thermal equator (ITCZ) lies generally to the north of the geographical equator.
- Isotherms show a poleward shift while passing through an area with warm ocean currents.
- Mountains affect the horizontal distribution of temperature, such as the Rockies and the Andes stop the oceanic influence from going inwards into North and South America.
Inter Tropical Convergence Zone
- The Inter-Tropical Convergence Zone (ITCZ) is a broad trough of low pressure in equatorial latitudes.
- It is where the northeast and the southeast trade winds converge.
- The convergence zone lies more or less parallel to the equator but moves north or south with the apparent movement of the sun.
Seasonal Temperature Distribution
- The global distribution of temperature is studied by examining the temperature distribution in January and July.
- Temperature distribution is shown on a map using isotherms, which are lines joining places with the same temperature.
- The effect of latitude on temperature is well pronounced on the map, as isotherms are generally parallel to latitude.
- The deviation from this trend is more pronounced in January, especially in the northern hemisphere.
- In the northern hemisphere, land surface area is much larger than in the southern hemisphere, leading to more pronounced effects of landmass and ocean currents.
- January:
- In January, it is winter in the northern hemisphere and summer in the southern hemisphere.
- The western margins of continents are warmer than their eastern counterparts due to the Westerlies.
- Isotherms show a regular behavior in the southern hemisphere.
- In the northern hemisphere, the isotherms deviate to the north over the ocean and to the south over the continent, with an equatorward bend over the northern continents indicating overcooling of landmasses and penetration of polar cold winds.
- Warm ocean currents like Gulf Stream and North Atlantic Drift make the Northern Atlantic Ocean warmer and cause poleward shift of isotherms.
- Lowest temperatures are recorded over northern Siberia and Greenland.
- In the southern hemisphere, the effect of the ocean is well pronounced, and the isotherms are more or less parallel to the latitudes, with the high-temperature belt running along 30°S latitude.
- The thermal equator lies to the south of the geographical equator due to the southward movement of the sun and the shift of Intertropical Convergence Zone (ITCZ).
- July:
- During July, it’s summer in the northern hemisphere and winter in the southern hemisphere.
- Isotherms generally run parallel to the latitudes in July.
- Equatorial oceans record warmer temperatures over 27°C, and over land, more than 30°C is noticed in the subtropical continental region of Asia along the 30°N latitude.
- In the northern hemisphere, the highest range of temperature is more than 60°C over the northeastern part of the Eurasian continent due to continentality.
- The lowest range of temperature, 3°C, is found between 20°S and 15°N.
- Over the northern continents, a poleward bend of the isotherms indicates that the landmasses are overheated and the hot tropical winds are able to go far into the northern interiors.
- The isotherms over the northern oceans show an equatorward shift indicating that the oceans are cooler and can carry the moderating effect into tropical interiors.
- The highest temperature belt runs through northern Africa, West Asia, northwest India, and the southeastern USA. The temperature gradient is irregular and follows a zig-zag path over the northern hemisphere.
- In the southern hemisphere, the gradient becomes regular but shows a slight bend towards the equator at the edges of continents. The thermal equator now lies to the north of the geographical equator.
Vertical Distribution of Temperature
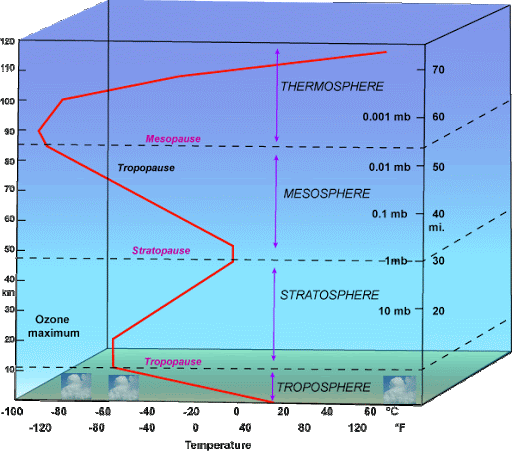
- The normal, lapse rate is uniform within the troposphere.
- The lapse rate stops at zero at the Tropopause.
- In the lower stratosphere, the lapse rate remains constant for some height.
- The temperature anomaly is the difference between the mean temperature of a place and its parallel.
- The largest temperature anomalies occur in the northern hemisphere.
- The thermal equator is a global isotherm with the highest mean annual temperature at each longitude around the globe.
- The highest absolute temperatures are recorded in the Tropics, but the highest mean annual temperatures are recorded at the equator.
- The location of the thermal equator is not identical to that of the geographic Equator due to the geography of a region, mountain ranges, and ocean currents.
- The thermal equator shifts towards the north and south with the north-south shift in the position of vertical rays of the sun.
- The annual average position of the thermal equator is 5° N latitude.